|
phystricks
|
|
phystricks
|
The purpose of this module is to produce pictures to be inserted in your LaTeX document using only python and Sage techniques. The motto is :
«*if Sage can compute it, LaTeX can draw it*»
tikz ?If you don't know what is LaTeX, simply read the description on wikipedia. For the moment you just have to know that LaTeX is a text editor with the same ideas of markdown or wiki, except that
pdf (which is static) while markdown or wiki will output an html file which is more dynamic.tikz is a set of macros for creating pictures in LaTeX. The weakness of Tikz for producing scientific pictures are :
People use an external program to produce the pictures and then include them as pdf, png or worse : ps ... even worse : epsi.
What's the problem with this approach ? If you want to name a point "A", it will appears with the font of the external program, not the font of you current LaTeX file, and you cannot use the LaTeX macros in the picture.
phystricksIncluding complex figures in LaTeX is always difficult because you
phystricks is a python (Sage in fact) module defining classes like point, segment, parametric curve, ... and many geometric relations between them. You describe your picture using Python and phystricks creates the tikz code to be included in your LaTeX file.
The you compile the picture with Sage :
Now the file Fig_VSJOooJXAwbVEt.pstricks is created and you just have to add the following lines in you LaTeX document :
What you get is :
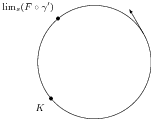
As you see, taking the tangent vector is a simple as calling the method get_tangent_vector with as argument the angle on the circle.
Notice that :
The trick is that phystricks does not only produces the tikz code for the picture, but also make LaTeX write the size of the box in an auxiliary file. Thus in a second pass of phystricks, the size of the box is known and the label can be correctly placed.
The LaTeX code inserted in your picture is compiled by LaTeX in the same time as your document.
For more informations you can read the documentation. An look at the real live examples :
This is my main page.
 1.8.11

